Within my work at Red Hat and Kubernetes SIG instrumentation I have been working on kube-state-metrics , a Prometheus exporter exposing the state of a Kubernetes cluster to a Prometheus monitoring system. In particular I have focused on performance optimizing metric rendering for both latency as well as resource usage. Below I want to describe our approach of metric driven performance tuning, using Prometheus to monitor kube-state-metrics on top of Kubernetes, which in itself enables Prometheus to monitor Kubernetes.
What is kube-state-metrics
Kube-state-metrics is a Prometheus exporter
exposing metrics about
the state of Kubernetes objects such as Pods and Deployments to Prometheus.
It listens for state changes via the Kubernetes API and exposes this state in
the Prometheus format
on http://xxx/metrics on each scrape by Prometheus.
One can think of kube-state-metrics as an adapter converting Kubernetes Objects
- apiVersion: v1
  kind: Pod
  metadata:
    labels:
      app: kube-state-metrics
      pod-template-hash: 5fc64f676f
    name: kube-state-metrics-5fc64f676f-gl6v6
    namespace: monitoring
into Prometheus metrics.
kube_pod_container_info{container="kube-state-metrics",namespace="monitoring",pod="kube-state-metrics-5fc64f676f-gl6v6"} 1
kube_pod_labels{label_app="kube-state-metrics",label_pod_template_hash="5fc64f676f",namespace="monitoring",pod="kube-state-metrics-5fc64f676f-gl6v6"} 1
Problem with kube-state-metrics < 1.4
Kube-state-metrics v1.4 and below is leveraging Kubernetes client-go and Prometheus client_golang to inter-operate with Kubernetes and Prometheus. Thereby kube-state-metrics only contains little amount of glue code and mostly business logic itself. On the one hand this keeps the complexity of the project low. On the other hand, both Kubernetes client-go as well as Prometheus client_golang are not optimized for the kube-state-metrics use case see e.g. user reports #257 and #493 .
The above trade-off serves us well on smaller Kubernetes clusters. Once kube-state-metrics is used on larger clusters with more than 50 MB of metric output, three properties become problematic, consequently forming our optimization targets:
1. Scrape duration
The reoccurring (e.g. every minute) process of Prometheus requesting Kubernetes
metrics from kube-state-metrics is called a scrape. Prometheus tracks the
start of the process, initializes the http request to kube-state-metrics
/metrics, parses the response and saves the values with the start timestamp in
its time series database. Both if kube-state-metrics respondes within a second
and within a minute, the values are saved with the same timestamp within the
Prometheus database.
Once scrape durations differ within consecutive scrapes of the same exporter (e.g. kube-state-metrics) or across exporters (kube-state-metrics and cadvisor ), it is difficult to correlate the collected data, as it could be off by as much as the scraping process lasted (minus network latency, http, tcp, ip overhead, …). Thus it is disirable to keep the scrape duration to a minimum. In addition Prometheus even times out by default once a scrape duration reaches 10s.
The metric scrape_duration_seconds exposed by Prometheus itself gives us visibility for the above, hence we can use it for the planned optimization.
2. CPU usage
Running kube-state-metrics on large Kubernetes clusters results in high CPU usage of kube-state-metrics as it has to convert the Kubernetes API objects to Prometheus metrics ad-hoc on each scrape of Prometheus. In addition this CPU load is not a flat line, but spiky, given that this CPU intensive process is part of the hot-path of Prometheus scraping the exporter.
As with the scrape_duration_seconds metric for the first optimization target, we can leverage the fact that kube-state-metrics can run on a Kubernetes cluster and use the container_cpu_usage_seconds exposed by cadvisor to get visibility into optimizing cpu usage.
3. Memory usage
As mentioned above, kube-state-metrics uses the Kubernetes client-go library to inter-operate with Kubernetes. More specifically it leverages client-go’s informers. While using informers keeps kube-state-metric’s code complexity low, it forces high memory usage upon it, given that kube-state-metrics is interested in all Kubernetes objects of a cluster, thus keeping a copy of all Kubernetes objects within the cache of the infomers. This is not problematic for small Kubernetes clusters but results in large memory allocations on larger ones.
Analogous to container_cpu_usage_seconds we can use container_memory_usage_bytes to track the memory usage of kube-state-metrics.
Introducing a custom cache
As previously mentioned kube-state-metrics v1.4 and below replicates all Kubernetes objects into its internal cache to ad-hoc convert them into the Prometheus metric format, once a new scrape request comes in.
``` +-----------+ +-------------------+ +-------------+ | APIServer | | kubestatemetrics | | Prometheus | +-----------+ +-------------------+ +-------------+ | | | | New Pod p1 | | |--------------------->| | | -----------\ | | | | Cache p1 |-| | | |----------| | | | | | | | | | | | | | Get all metrics | | |<---------------------------------------| | | --------------------------------\ | | |-| Render all Kubernetes objects | | | | | into metrics | | | | |-------------------------------| | | | | | | Metrics | | |--------------------------------------->| | | |</small>
This lead us to an idea. Instead of caching the Kubernetes objects themselves,
how about rendering them into Prometheus metrics right away and only cache the
rendered metrics instead. This has three advantages: First Kubernetes object to
metric rendering is not happening in the hot-path (scrape) anymore reducing
scrape duration. Second caching metrics instead of full Kubernetes objects
reduces needed memory. Third, under the premise that most Kubernetes objects
stay untouched between consecutive scrapes, metrics are rendered once per
Kubernetes object update, not once per scrape, reducing CPU usage.
<small>
+———–+ +——————-+ +————-+ | APIServer | | kubestatemetrics | | Prometheus | +———–+ +——————-+ +————-+ | | | | New Pod p1 | | |————————–>| | | ———————–\ | | | | Render metrics of p1 |-| | | |———————-| | | |————————-\ | | || Cache rendered metrics |-| | ||————————| | | | | | | | | | | | | | Get all metrics | | |<———————–| | | | | | Metrics | | |———————–>| | | |
</small>
Instead of replacing all of Kubernetes client-go with our own specialized
implementation, which increases the maintenance burdon given that Kubernetes is a
fast moving project, it is possible to hook into client-go via the [ *Reflector*
](https://github.com/kubernetes/client-go/blob/master/tools/cache/reflector.go)
abstraction and implement a custom cache, in our case for metrics instead of
Kubernetes objects.
The result can be seen in the graph below, showing the duration of Prometheus
scrapes of the old version (v1.4) in red and the optimized version in cyan.
Introducing the optimized cache lead to a ~10x improvement in our test
environment. Please keep in mind that this was under artificial load. Numbers on
real world clusters will be shown further below.
<img src="/static/metric-driven-performance-optimization/result-caching.png">
## Compression on or off?
Next up we looked into compression of the metric payload going back to
Prometheus. By default kube-state-metrics v1.4, more precisely Prometheus
client_golang, compressed its responses. Doing so sounds reasonable, given that
the Prometheus metric format is repetitive, thus great for compression, but
still we wanted to investigate this default option, given that most deployments
are running in a local area network.
We deployed kube-state-metrics in four versions: v1.4, cache-optimized without
compression, cache-optimized with golang gzip, cache-optimized with [New York
Times gzip](https://github.com/NYTimes/gziphandler). First off we can compare
the CPU usage. Without surprise compressing is more CPU intense:
<img src="/static/metric-driven-performance-optimization/compression_cpu_usage.png">
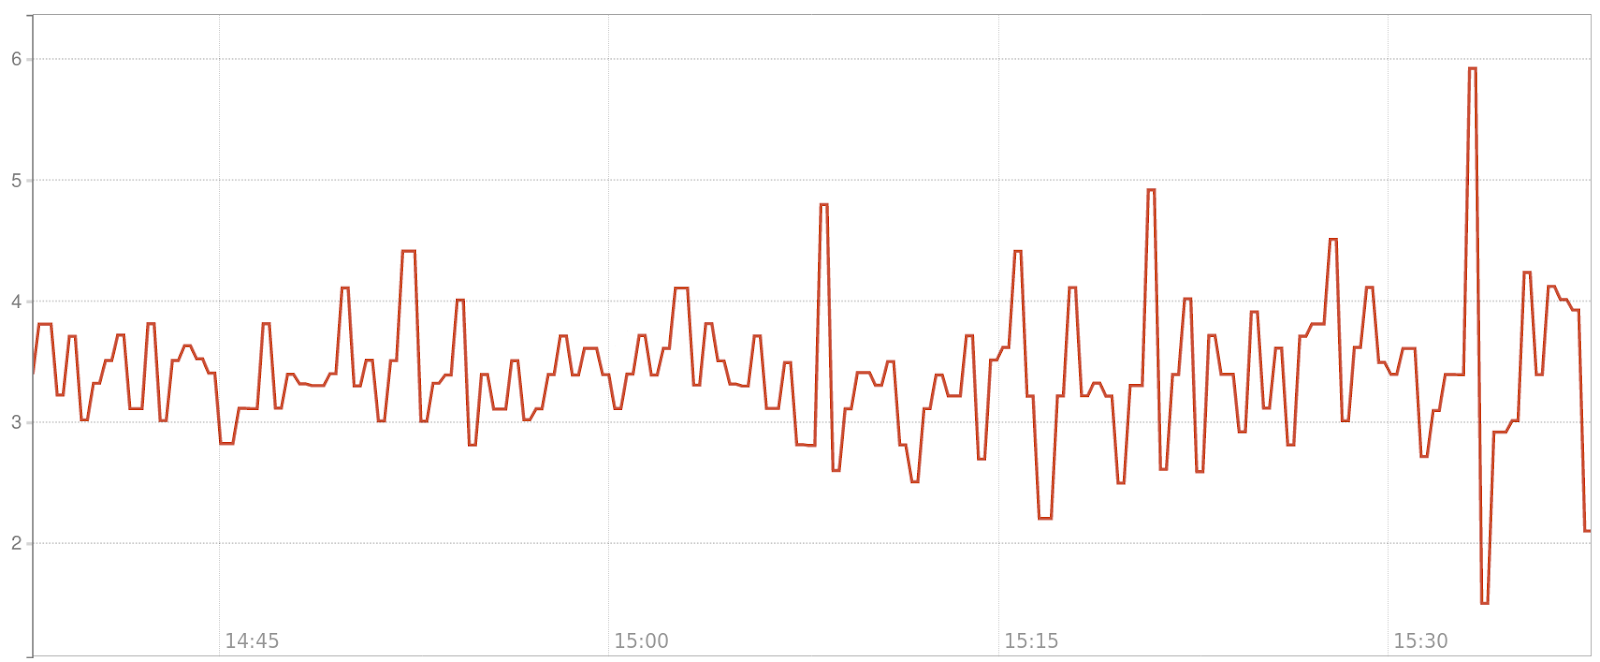
Next we can take a look at the memory usage (not allocation). One would think
that using compression kube-state-metrics would use less memory. Problem is,
that we are not caching a big blob of metrics of all Kubernetes objects, but
instead we are caching multiple blobs of metrics per Kubernetes object. That
way, once an update for a single Kubernetes object comes in, one does not have
to recompute the big blob, but only the metric blob for that specific Kubernetes
object. With this in mind, for a scrape we have to cumulate all the blobs and
then compress. Thus compression does not decrease the memory footprint, but
quite the opposite, increases it.
<img src="/static/metric-driven-performance-optimization/compression_memory_usage.png">
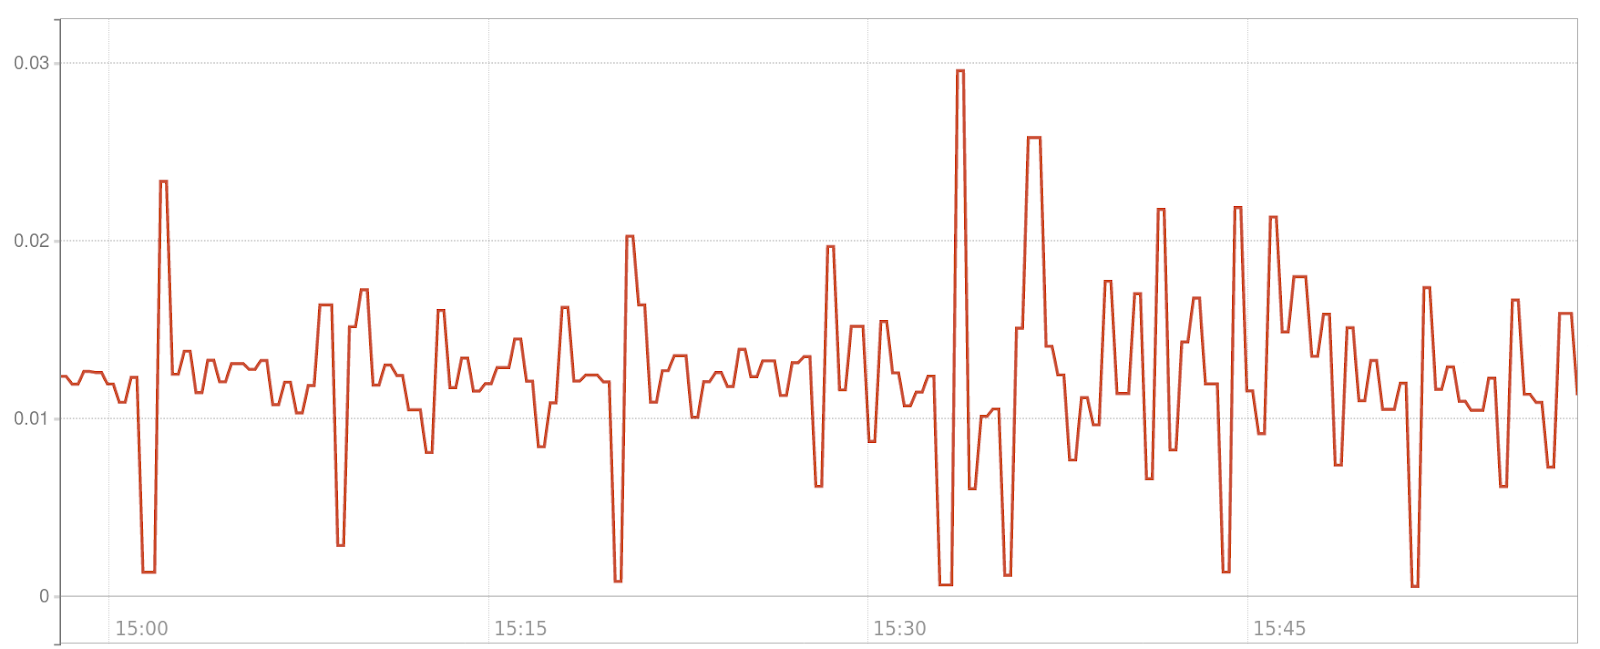
Last we should take a look at the impact of compression on the scrape duration.
In our test environment Prometheus and kube-state-metrics are within the same
local area network. The graph below shows, that transfering bigger metric blobs
in plain-text is faster than transfering smaller compressed metric blobs +
compressing and decompressing. Thus, as you can see in the graph below
kube-state-metrics with optimized caching but disabled compression has the
lowest scrape duration.
<img src="/static/metric-driven-performance-optimization/compression_scrape_duration.png">
After testing this in multiple real world scenarios, we ended up adding the
option to compress to the new version of kube-state-metrics but disabling it by
default.
## Golangs _strings.Builder_
While optimizing kube-state-metrics itself, a lot happened on the Prometheus
upstream [common library](https://github.com/prometheus/common/pull/148) in
parallel. Among other things the library switched to using Golangs [
strings.Builder ](https://golang.org/pkg/strings/#Builder). Instead of
formatting strings via `fmt`, which bears many memory allocations with it,
`strings.Builder` uses a byte slice under the hood, leveraging the fact that
byte slices in constrary to strings are mutable. Many of these optimizations
also landed downstream in kube-state-metrics.
## Benchmarks
Given the wide spread usage of kube-state-metrics in the Kubernetes community,
many users helped us to test the performance optimized version of kube-state-metrics.
You can find multiple benchmarks in [ this
](https://github.com/kubernetes/kube-state-metrics/issues/498)
Github thread.
---
This blog post is based on a [talk I gave at KubeCon Barcelona
2019](https://kccnceu19.sched.com/event/MPjo/deep-dive-kubernetes-instrumentation-sig-frederic-branczyk-max-inden-red-hat).
The [recording](https://www.youtube.com/watch?v=dvk_-NCK1Ls) is online. The
[slides can be downloaded
here](/static/metric-driven-performance-optimization/slides.pdf).